This is the first in a series of posts on evaluation metrics for recommender systems. It’s important to be able to measure attributes of your recommender so that you can start to understand it better and eventually improve it. These metrics allow you to predict both how well your recommender will perform before you test it with real users (i.e. offline testing) and how well it performs when put in front of users (i.e. online testing). Here we’ll cover a number of standard metrics that tend to be useful for most recommender use cases although you’ll probably want to add some extra ones that address your specific goals. In this post we’ll introduce the different families of metrics and provide examples of them. In future posts, we’ll then dive into each metric family in more detail, providing implementations of them as we go.
In this series we’ll cover metrics from six families:
- rating and usage prediction accuracy
- user- and item-space coverage
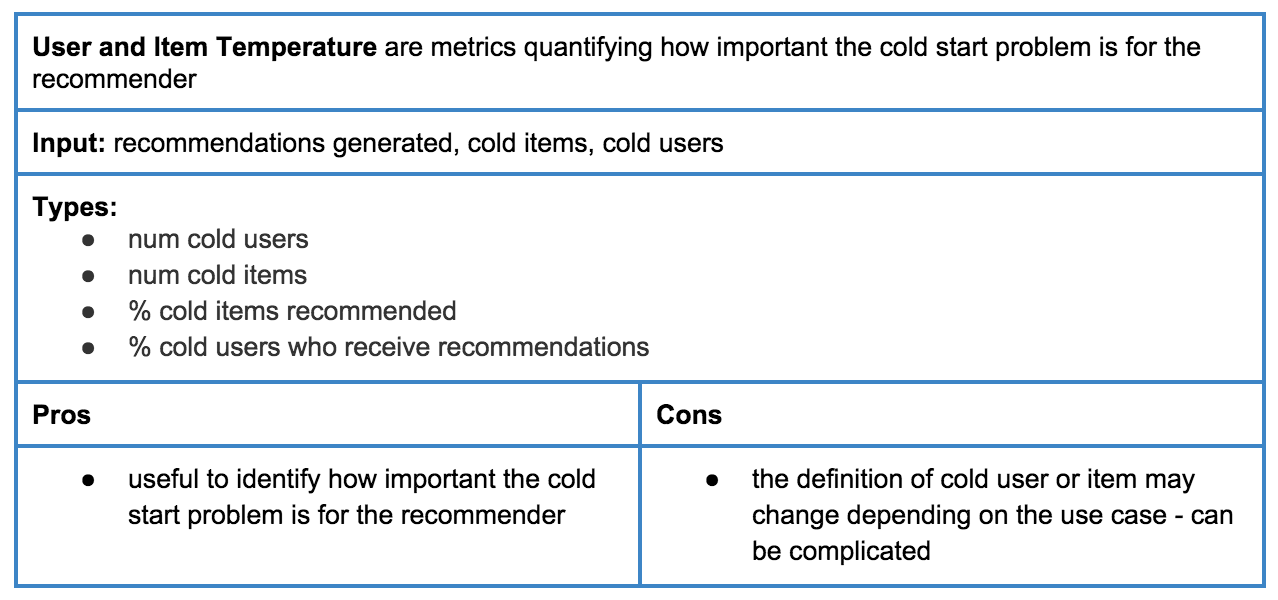
- user and item temperature
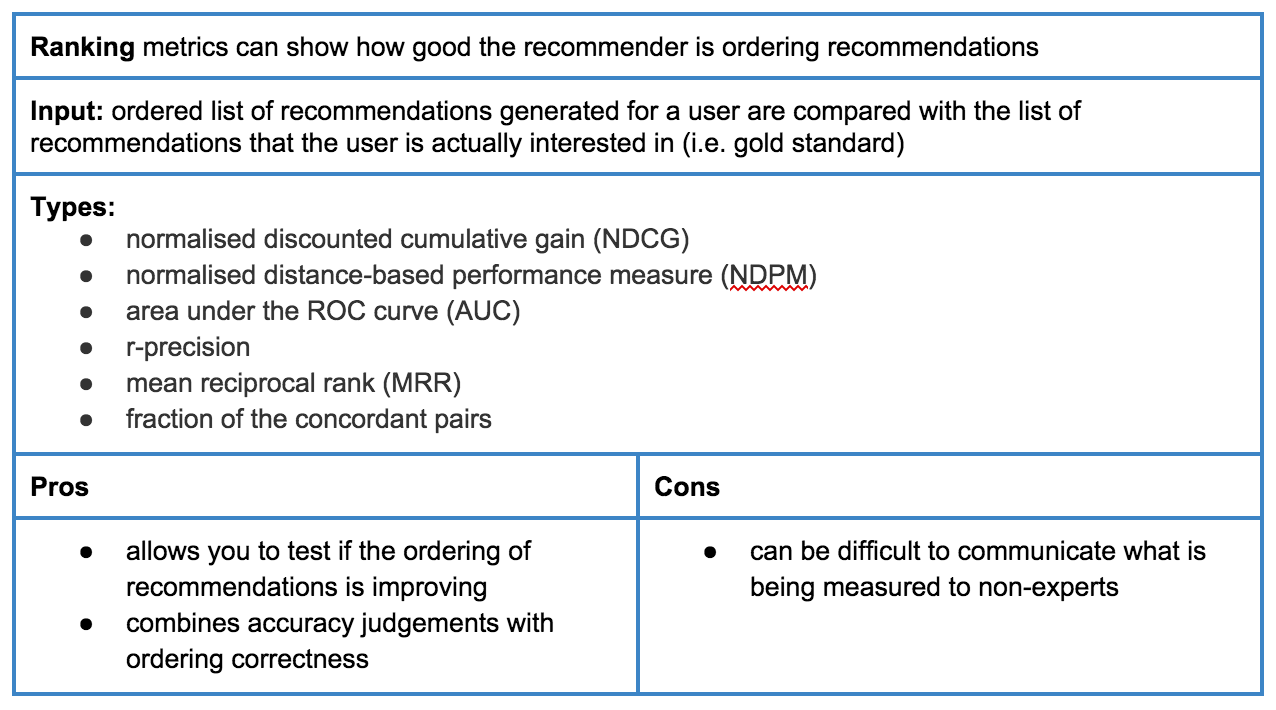
- ranking
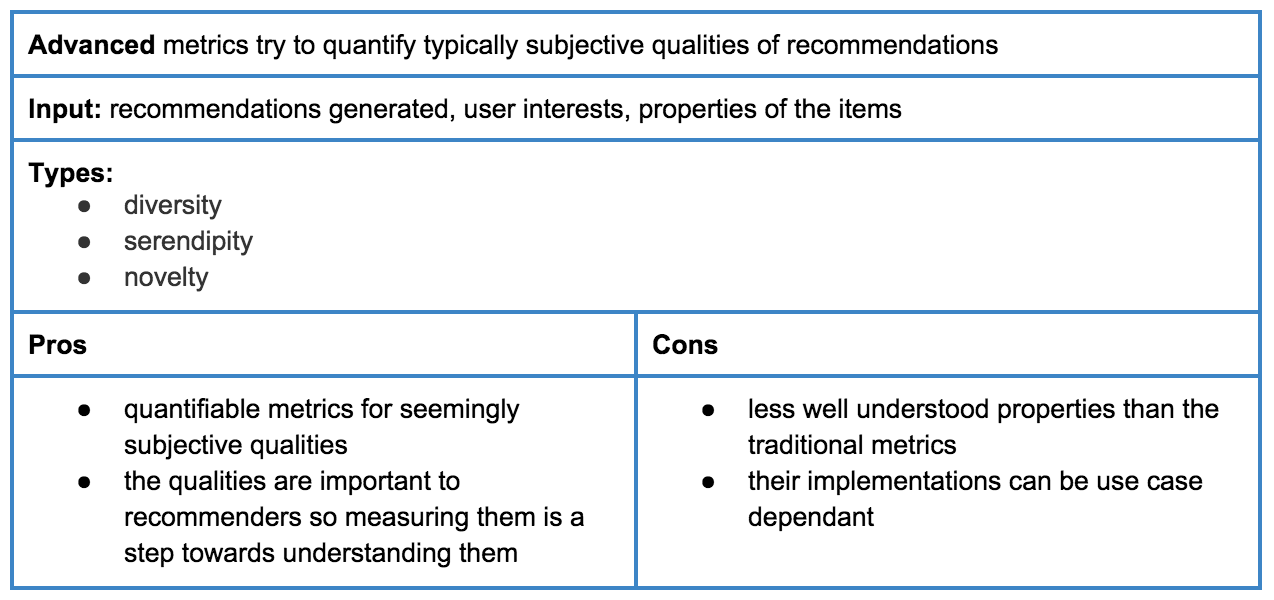
- ‘advanced’ metrics
- online metrics
First, we’ll look at some metrics for rating and usage prediction accuracy (Table 1). These can be used to measure a recommender system’s accuracy in terms of performance both in offline and online settings. These metrics are mainstream and mostly originate from the information retrieval community. Information retrieval systems (i.e. search) and information filtering systems (i.e. recommenders) share a number of commonalities, principle among them being they both aim to provide relevant items for users, typically in the form of an ordered list.

Second, we’ll look at the metrics that can be used to measure the coverage of your recommender system (Table 2). Regardless of your use cases, it’s often common to want to be able to know both how many users are getting recommendations and how many of the items in your collection are being recommended to all users who get recommendations.

Third, we’ll be building some recommender systems thermometers. This isn’t as strange as it sounds. We’re interested in understanding the users of your system and the items that you are recommending in terms of how many of them are warm or cold (Table 3). Typically, a warm user is a user for whom you have some usage data (e.g. items that have bought in the past) whereas a cold user is a user for whom you know nothing, and recommending items to them is referred to as the cold start problem. Similarly, warm items are items that you want to recommend and have some usage data associated with them (e.g. you know which users have previously bought or viewed them) whereas cold items are items for which you have no usage data. It’s useful to pay attention to cold users and items as recommenders can have more trouble with them. In particular, if you use algorithms that don’t generate recommendations for cold users (e.g. collaborative filtering) then this metric can act as a warning that you’re not reaching most of your users.
Whenever you display recommendations to users, you need to choose the order in which they will appear. There are a number of useful metrics that can be used to determine how relevant the rank, or ordering of items in the list is (Table 4).
Beyond these more standard metrics there are also a number of metrics that are used to try to measure some properties of the recommender that may appear to subjective at first sight (Table 5). It is worth mentioning them as they are very useful metrics that can help you to choose how to improve the recommender. Getting these right can make the difference between a bad and a good product.
Finally, there is a number of metrics that tend to be more mainstream for quantifying the quality of recommendations given to users in the online setting. These metrics will often be the ones that you want to keep a close eye on when your recommender is live and it may be that one of these is your goal. For example, if you goal is to increase engagement with your product then looking at the overall Click-through-rate (CTR) is a possible measure of this.

It is not necessary to implement all of these metrics but the more that you put in place the better you can understand how your recommender is performing and, more importantly, you can tell if its performance improves or suffers when you make a modification to it.

Mean Average Precision is a ranking metric.
LikeLike
Thank you for your blog articles. They are really helpful! Will you still write part 2 and 3?
LikeLike